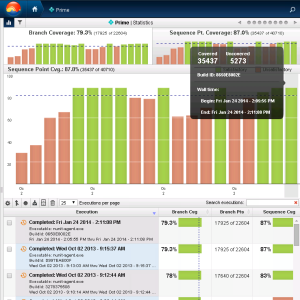
 When it comes to measuring the overall quality of your code, there are a variety of code coverage metrics you can use. Typically, each metric will follow a particular methodology for breaking code down into sections and then reporting on which of those sections were tested. The methodology followed and the code coverage metrics subsequently reported, can produce significantly different results and have a meaningful impact on how you view your code and deploy your development resources. This post is focused on sequence-point coverage, the base code coverage number used by NCover.
Understanding The Basics
In order to more fully understand sequence-point coverage, it is helpful to understand two more basic code coverage metrics, Line Coverage and Statement Coverage.
Line Coverage – The Most Basic Metric
Many coverage tools report line coverage, which is probably the most basic coverage metric. Line coverage simply measures whether a particular line of code was executed or not.
Below is an example of the results you might get when running a moderately complex bit of code.
// Line Coverage
    bool SampleFunction() {
1        doA(); doB();
2        switch(GetMagicNumber()) { case 10: return true; default: return false;}
    }
// 2 covered lines / 2 coverage points = 100% coverage
The greatest limitation of line coverage is that almost all code of any complexity will contain lines with more than one statement or instruction. In these scenarios, line coverage can mask problems by overstating how well the code was tested.
Statement Coverage – Better, But Limited
Statement coverage is a slightly more specific metric which differentiates when multiple code statements are included on a single line of code. With statement coverage you might see something like this:
// Statement Coverage
    bool SampleFunction() {
1 2      doA(); doB();
3        switch(GetMagicNumber()) { case 10: return true; default: return false;}
    }
// 3 covered statements / 3 coverage points = 100% coverage
In this scenario, statement coverage identifies the line of code with two statements and accounts for each statement when reporting the total coverage. However, by looking at the last line of code you can see that although there were various nodes, or decision points, and the last case of “ItWasnt()” was not exercised, statement coverage still shows 100% coverage.
Sequence-Point Coverage – A Better Code Coverage Metric for .NET
It is important to understand what information your coverage tool is reporting. As you can see in the example of line coverage and statement coverage, both metrics reported 100% coverage even though not all of the code was being executed. In both of these scenarios, the code coverage metric was too broad and did not highlight uncovered code.
Sequence-point goes a step further and differentiates between each point where the debugger is able to stop when single-stepping through a code file. NCover uses the compiler’s debug symbol database to provide this information, so it is guaranteed to provide the same points that the Visual Studio debugger will use when debugging.
With sequence point coverage, you should see the following, assuming GetMagicNumber() returns 10:
// Sequence Point Coverage
       bool SampleFunction() {
1 2      doA(); doB();
3 4 5    switch(GetMagicNumber()){ case 10: return true; default: return false;}
       }
// 4 covered sequence points / 5 coverage points = 80%% coverage
In this scenario, sequence-point coverage yields a code coverage metric of 80%, highlighting the fact that the false value was never returned, the exact point that was not exercised.
As your code grows over time and becomes more complex, the need for a better code coverage metric is amplified. By using sequence-point coverage as the base coverage metric, NCover ensures that you are generating code coverage results that are not only accurate but also useful as you maintain the overall health of your code base.
I’ve written a blog post about this topic, here: http://blog.szulak.org/dev/sequence-points-c/
Would you mind and leave your feedback, please?
regards,
szulak